This article is part of IoT Architecture Series – https://navveenbalani.dev/index.php/articles/internet-of-things-architecture-components-and-stack-view/
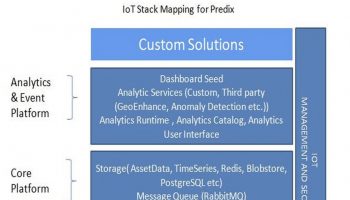
In previous article we went through the Predix IoT Stack. In this article, we will go through implementing the connected elevator solution using Predix IoT Stack
Hardware and Connectivity
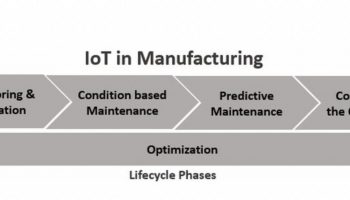
In this section, we would discuss the hardware and connectivity approach for the elevator use case. We will realize the elevator use case using Predix IoT stack through the following phases we described in earlier article – viz. monitoring (which includes asset management), condition maintenance and finally predictive maintenance.
We would not go into the details of each phase again but only talk about the implementation steps. The manufacturer as part of his connected design exercise adds various new sensors to the existing elevator control unit to realize the requirements as mentioned in earlier article. The elevator manufacturer as a first step leverages its existing investment and tries to keep the connectivity and communication protocol between elevator control unit and rest of components same and installs the Predix Machine on the elevator machine controller. The Predix Machine acts as a gateway providing local storage, analytics, and filtering of events and also provides secured communication with the Predix Cloud. The Predix Machine component wraps the filtered data into JSON data and sends it over MQTT protocol to Predix Cloud platform. Through the Predix EdgeManager Web interface, the device is remotely monitored and managed.
Software Implementation Overview
The following are the high-level steps that needs to be performed to build the IoT application
- Generate the Predix Machine OSGI container artifact containing the required features using Predix Machine SDK.
- Register devices and get access credentials through EdgeManager.
- Provision devices (elevator control device) through EdgeManager and install the Predix Machine OSGI container from Step 1 on the devices.
- Create storage services (Create the asset model and store the model and instances using Asset Data service and create Time Series service for storing raw time series data from devices).
- Configure Message Topics for communication from devices to Cloud and various Cloud services.
- Create Analytical Code.
- Deploy Analytics code in Analytics Catalog.
- Create Analytics Orchestration configuration for the analytical code and execute analytics orchestration using Analytics runtime.
- Create web dashboards and/or create Mobile applications using Mobile SDK for remote monitoring and management.
Note – We choose to use an example of running elevator machinery 24*7, instead of picking up a complex industrial use case like oil machinery or water management plant. The steps outlined would be pretty much the same as described above with the addition of complexities around integration with existing industrial devices using protocols like ModBus or setting up a secured compliant network infrastructure from existing manufacturing plants to Predix Cloud.
The above implementation steps are just one of the approaches for building end to end IoT application. The following shows the connected elevator solution using Predix cloud platform and services.
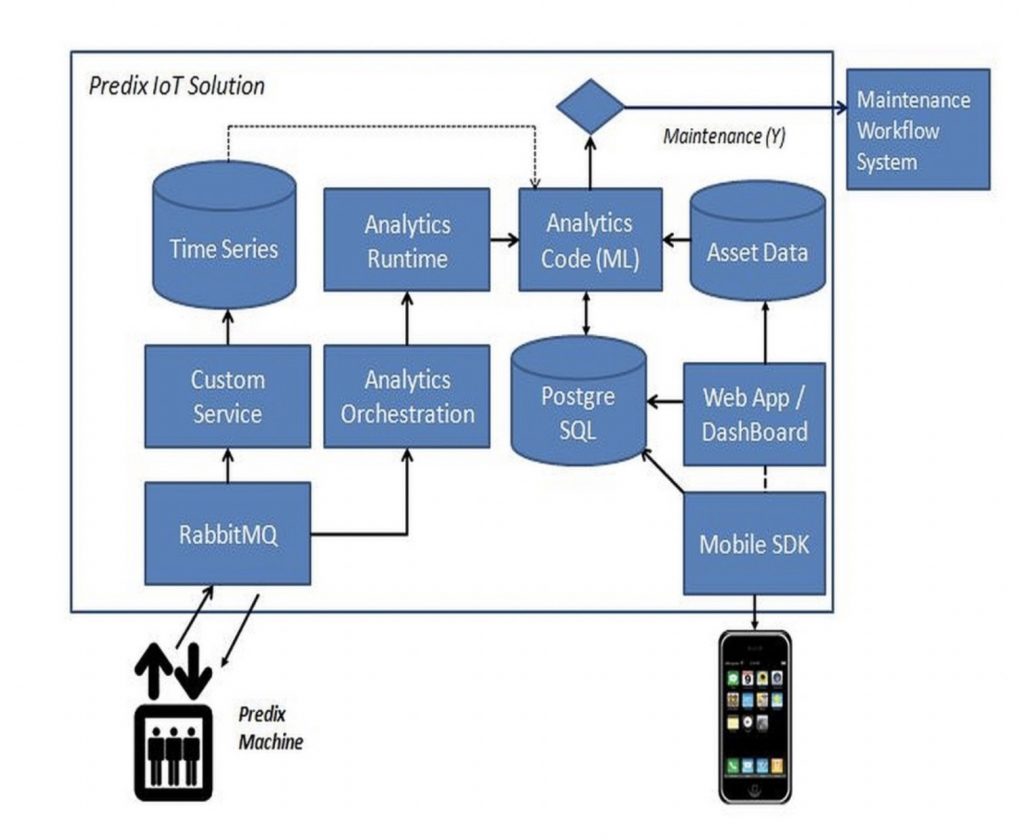
The RabbitMQ service in Predix Cloud receives the data from the connected elevator (controller device) over MQTT protocol. The controller device has Predix Machine software stack installed and uses the MQTT River component to send data to configured topics in RabbitMQ. A custom service is deployed which subscribes to the configured topic and uses the Time Series service to store the time series data. The time series data represents a timestamp and value for each sensors (like temperature, pressure , load etc) which are continuously streamed from the devices, which can be stored and filtered by Predix Machine software component on the elevator control device to do local analysis and/or send it directly to the Predix cloud for analysis. This provides an option of doing simple condition based monitoring and triggering alerts locally and also send only the relevant information over to the cloud. The real advantage is that the device can be remotely monitored, and the software stack can be updated remotely to add new customizations.
Tip – We could also have used WebSocket protocol instead of MQTT. For supporting WebSocket protocol, we need to use WebSocket River component in Predix Machine software stack to connect to the Predix cloud. The WebSocket River component can also directly post the time series data from devices/sensors to Time Series Gateway component in Predix Cloud.
The Analytics orchestration component is triggered based on message arrival on the specified topic, and the required analytic workflow (it can be a single workflow containing your analytical code) is executed by the analytical engine/runtime.
For the elevator use case, two analytical components are developed, one for detecting anomaly and other for predictive analytics. The analytics code uses machine learning models and is developed using Python and scikit-learn library. The machine learning model uses time series data, asset data, and historical records as inputs for analysis and predictions.
The analytics code is uploaded to Predix Analytics catalog using Predix Analytics User service. Any dependent libraries need to be specified in a configuration file as per the analytics development process (reference – https://www.predix.io/docs/?r=317800#alaepr9P)
Once the analytic code is tested, you promote it to production state, where it is executed by the analytics runtime.
Tip – As mentioned earlier, the approach of building a machine learning model, whether using Microsoft, Amazon or IBM tools or open source options like Python scikit-learn library remains the same. You build the model and train the model iteratively using the raw data from the connected devices, asset metadata and historical maintenance records. The real challenge in building the model is choosing the right features, cleaning( or filtering) and aggregating the data, applying algorithms, training the model and continuously iterating it to reasonably predict the outcome.
Based on the response of analytics service (if maintenance is predicted or required), the maintenance workflow service is triggered. The status is updated in the Postgre SQL database which keeps the track of maintenance activity.
A web dashboard is developed which pulls the data from the data sources (time series, asset data and Postgre SQL database) that shows real-time updates on the entire process and provides monitoring of the assets. The same information is also made available in mobile applications and can also trigger/notify users to take corrective action. The mobile application is developed using Predix Mobile SDK framework, which enables quickly building applications using standards like HTM5 and JavaScript.
This completes an end-to-end execution cycle using Predix cloud.
In the next article, we will look at how to build IoT solutions using Open Source stack
